Max Wilson (Papers Co-Chair 2023 and 2024)
In this blog post, I look at data from the CHI2023 reviewing process, particularly in phase 1 (the first reviews that every paper gets). I analyse the difference between reviews that get marked as ‘high quality’ and those that do not. I examine length in relation to recommendation, decision outcome from phase 1, and reviewer role. I examine whether authors do actually serve as reviewers in practice. And finally I examine the expertise of reviewers and ACs in the different subcommittees.
Review Quality
A passion of mine is good quality reviews. I teach a course on good reviewing (running in person at CHI2023!), and I’m excited that community efforts exist to help people understand the ever-evolving process at CHI. Different people have also collected resources on reviewing (such as Aaron Quigley’s list). Good reviews typically a) summarise the reviewers’ understanding of the paper’s contribution, b) address both the strengths and weaknesses of the paper for each of the criteria listed by the venue, c) (perhaps most importantly) reason directly about the recommendation they are making (so that authors and other reviewers can understand how the review text relates to the recommendation), and d) lists minor details (editorial changes/links to missing references, etc.) that are largely irrelevant to the recommendation but useful.
We do not have an exact way to examine all reviews for these factors, but length is a first-step proxy. Reviewers cannot achieve all 4 of those effectively in <50 words, for example. And short reviews that say ‘this should be accepted’ or ‘this should be rejected,’ with very little other detail or reasoning, are not constructive or helpful to either authors or senior reviewers (that we call Associate Chairs (ACs)). My analysis below looks at review length, at least, as an investigation into one aspect of review quality. Note: in the analyses below, some of the data is not available to me for papers that I am conflicted with.
Overall, the average length of reviews in phase 1 was 580.4 words, median 497. The longest being 3723 words (for an RRX recommendation), and shortest being 33 words (for an Accept recommendation). There were 90 reviews that were less than 100 words: 9 Accepts (A), 7 Accept or Revise & Resubmit (ARR), 13 Revise & Resubmit (RR), 9 Reject or Revise & Resubmit (RRX), 52 Rejects (X), excluding desk and quick rejects. One paper received two of these (inc one from a 2AC!), which led to an email complaint from the authors – as I would do too. Out of ~12,000 reviews (a little hard to tell with desk rejects and conflicted data), 1621 reviews were less than 250 words and 5976 were less than 500 words.
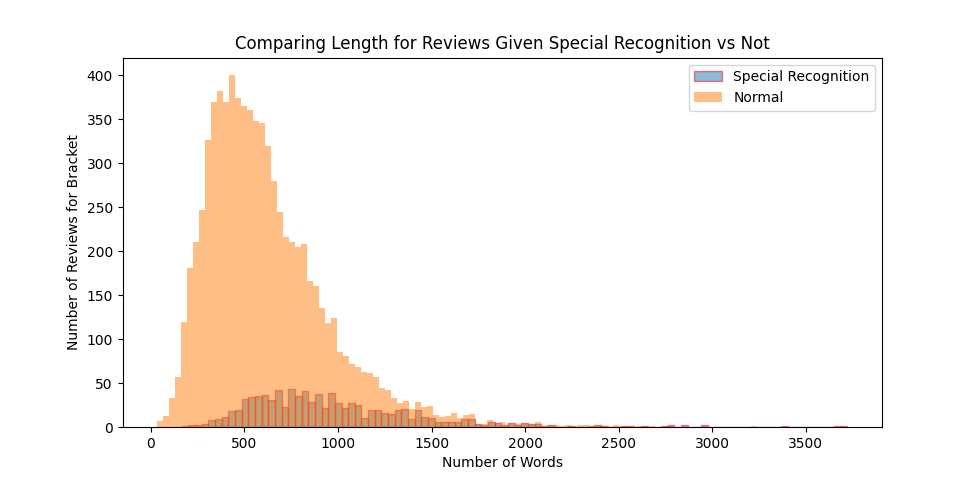
One bit of data we do have is where a review can be given a ‘Special Recognition’ tick by the 1AC of the paper (the lead AC). This data is fallible in that some ACs may have neglected to consider giving these ticks, but looking at the 1 in 10 that were given a recognition mark is interesting. The histogram and data table below show the breakdown of reviews given a Special Recognition mark of quality by the 1AC, or not. We can see the average length of ‘good quality reviews’ is much closer to 1000 words (984.9), than the average 622.9 for the remaining reviews.
| Quality Mark Given | Not Given | |
|---|---|---|
| Count | 938 | 7824 |
| Min | 165 | 33 |
| Avg (stdev) | 984.9 (472.7) | 622.9 (333.9) |
| Median | 890 | 553 |
| Max | 3723 | 3239 |
Length by Recommendation (Excluding Desk and Quick Rejects)
The histogram below shows the number of reviews (vertical axis) in the brackets by number of words (horizontal axis). The green line shows the spread of Accept reviews, ranging between 33 words and 2101 words (avg 460.4 words, median 413). The purple line shows the AARs. The blue line shows the RR recommendations – we are starting to see that there were substantially more negative reviews than positive ones in round 1 of CHI2023 (something we see every year). The yellow line shows RRX reviews as being longer, overall, than the Reject (X) reviews in red. In general, looking at the data table, we see that reviews were longer and more detailed where there was more reason to reject the paper, but with slightly fewer words where a paper is a clear reject (X) compared to less clear (RRX).

| A | ARR | RR | RRX | X | |
|---|---|---|---|---|---|
| Min | 33 | 47 | 53 | 60 | 41 |
| Avg (stdev) | 460.4 (264.9) | 516.6 (299.2) | 566.7 (338.8) | 637.9 (372.6) | 558.5 (386.2) |
| Median | 413 | 448 | 490 | 559 | 460 |
| Max | 2101 | 2340 | 2969 | 3723 | 3392 |
Review Length by Round 1 Outcome, and Type of Reviewer
We see below the average lengths of reviews given in round 1 by people in different roles. We see again that the average length of reviews is slightly longer for rejects (in blue) than those that received a revise and resubmit decision. 1AC meta-reviews are notably shorter than 2AC and external reviews; however, 1AC meta-reviews do serve a different function and have different expectations for their content. One decision taken in 2018 was that the ACs would also write full reviews – they would have ~7 papers as 1AC (primary AC writing meta-reviews) and another ~7 papers as 2AC writing normal reviews. This decision was taken as there was concern that many of the most experienced reviewers in the field were acting as meta-reviewers, and not contributing their expertise to review papers. Using this 1AC and 2AC balance, every paper also receives a review from the typically more experienced ACs. Notably, though, we see a 120-word difference in the average length of reviews between 2AC and reviewer, indicating that reviews from 2ACs are shorter than those provided by reviewers. This could be to do with load, with ACs having 14 papers to deal with in total, with 7 of those being full reviews as 2AC.

Contribution of Reviewers
Excluding ACs, the average number of reviews contributed by external reviewers was 1.72, with the maximum being 9. 53 people contributed more than 5 reviews, and 11 of those contributed 7 or more. Their reviews (as shown in the table below), however, were not insignificant in length. These involved a mix of phd students and faculty members at different levels, but for anonymity’s sake, I have not listed which was which in terms of career stage, especially as there was no obvious trend between career stage and average length in terms of review.
| Type | #Reviews | Avg. Length (Words) |
|---|---|---|
| reviewer | 9 | 404.4 |
| reviewer | 8 | 1130.9 |
| reviewer | 8 | 1027.8 |
| reviewer | 8 | 648.4 |
| reviewer | 8 | 639.1 |
| reviewer | 8 | 496.5 |
| reviewer | 8 | 421.5 |
| reviewer | 8 | 378.9 |
| reviewer | 7 | 921.3 |
| reviewer | 7 | 805.6 |
| reviewer | 7 | 721.9 |
Did Authors Actually Review?
We expect, as part of the agreement of submitting, that authors contribute back as reviewers. Of course, this is a slightly simplified request for a complicated situation, as some authors are first-time authors and have no track record of expertise to review. Equally, there are out-of-field authors making partial contributions to papers, and likely some, e.g., senior professors unknowingly named as being part of an extended supervision committee. Further, there are entirely out-of-scope papers that were desk rejected that also do not have expertise in HCI to review. Regardless, like previous CHIs, I decided to investigate whether reviewers were authors and whether authors were reviewers in CHI2023. Of interest, CHI papers have a lot of authors. Of 3182 CHI2023 submissions, one had 25 authors, 104 had 10+ authors, and 857 had 5+ authors. Conversely, only 82 papers had a single author.
Of 3921 people involved in reviewing full papers (including subcommittee chairs and the papers chairs), 2170 were authors, out of 10026 authors total. That leaves 7856 of the authors that did not review a paper (or act as a committee member), including 79 that authored 5+ papers, and 9 that had authored 10+ papers. Conversely, the other 20 or so authors of 10+ papers did get involved in the review process. Next, I considered individual authors, their reviewer cost generated, and reviews contributed (including committee member contributions). For every paper submitted, I gave an author a cost of 1/n authors of that paper. So an individual author of several papers would generate a total cost as the sum of these author contributions. For example, this would lead to 0.333 for an author that was named on only 1 paper as one of 3 authors. Or something like 4.666 if they were named as an author on many papers. I then subtracted the number of reviews that each author completed to investigate if they were in review-debt. The histograms below (in linear and log scale), show peoples review-debt scores as mediated by then being involved in the review process. Note: the conference organising committee and subcommittee chairs (where their contribution is not measured in number of reviewers done) sit together with an arbitrarily chosen fixed review-credit of -15.
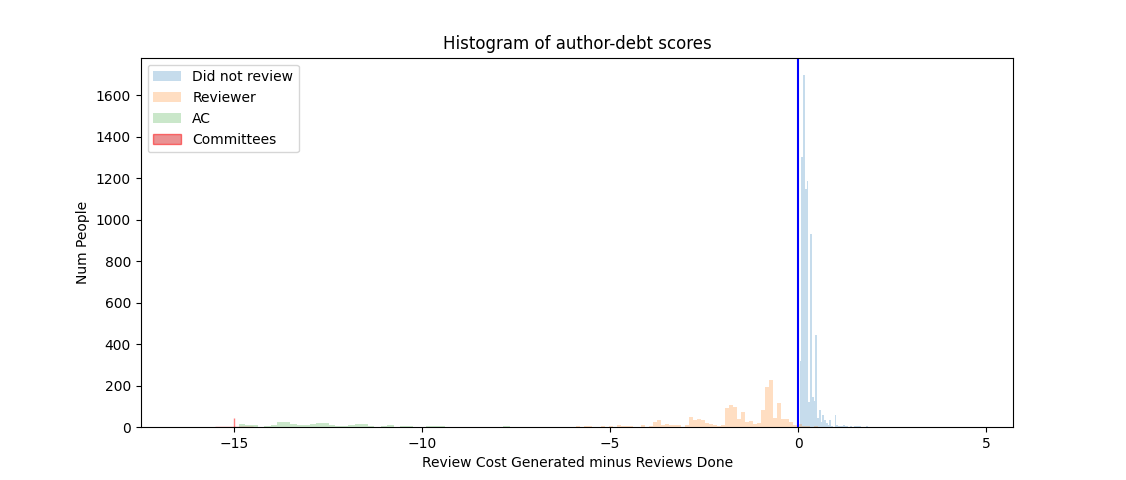

The ~400 ACs involved in the process are in green and largely (but not exclusively) sit to the left of the divider, in review-credit. Any ACs still in review-debt were likely brought in as an AC for specific papers (rather than general AC duty). Authors that were external reviewers (n=1778) were largely, but not exclusively, to the left of the divide (in review-credit). Authors that did not review sit to the right of the divider, with 6644 sitting between 0-0.34, named as, e.g., 1 of 3+ authors on one paper. These will likely include the first-time authors not yet experienced enough to review, although there are only ~3000 papers, so that’s perhaps 2+ per paper. In total, the people to the right of the divider include some 7934 authors that are in review-debt, and it is perhaps the 1253 with review-debt scores between 0.34-5 (only 33 with a review-debt more than 1.5), where their score implies they are submitting several papers and are not providing reviews, that are of interest for expanding the reviewer pool. Some authors (typically full professors) generated a cost between 1-5 from submitting, e.g., 8, 15, and even 21 papers, and did not contribute a commensurate number of reviews. Perhaps they are volunteering in other conferences and/or reviewer pools, although anecdotally some experienced professors tell us that they are typically not invited to review because people assume they are busy.
Do the Authors of Each Paper Produce 3 (or 4) Reviews?
This analysis above is still a somewhat oversimplified view. Each paper generates a demand for 3 reviews, and the authors between them could be covering this review-debt. In fact, it also generates a need for a 4th artefact: a meta-review. Since the data below includes the efforts of ACs, I will present numbers below both as based on 3 reviews (and 4 reviews in brackets). Running through the data (which, as a reminder, is slightly inaccurate as I cannot see data for papers that I am conflicted with), the authors of 1473 of 3180 submissions did not produce 3 reviews (1687 did not produce 4); some did contribute some reviews, as only 901 papers led to 0 reviews from the authors. Notably, that is just shy of a third of papers not producing any, and around half not producing enough. The calculation is also naive, as an author may be on many papers, meaning that if reviewer X contributed 3 reviews, but was an author on 10 papers, then 10 papers were marked as having an author that contributed 3 reviews. Instead, I removed 3 reviews from the total of reviews done per reviewer, for each paper they authored (note, this was typically 14 papers for an Associate Chair managing 7 as 1AC and 7 as 2AC). Although this approach is still potentially suboptimal (as there may be more optimal distributions of contributed reviews to papers – my algorithm started with the papers with the fewest authors, and then started with the first author (often the most junior author), allocating review-credit to those papers and stopping when the paper’s authors produced at least 3 reviews), the results show that the authors of 1885 papers did not generate 3 reviews (2156 did not generate 4), with 1278 contributing zero reviews (1366 if based on allocating 4 reviews). These numbers largely confirm the findings of Jofish Kaye’s analysis after CHI2016 – that the authors of approx 2/3 of papers are not pulling their weight in terms of review effort.
These numbers above still paint a naive picture. Authors may be general chairs, technical program chairs, papers chairs, subcommittee chairs, or chairs of other venues like late-breaking work. Really – contributing to the review pool includes contributing in many different ways across the committee. Unfortunately, I only had immediate access to organising committee and subcommittee chair data for the analysis. Considering these indirect committee contributions, the authors 1769 papers did not generate 3 reviews (2007 did not generate 4), with 1217 not generating any reviews (1288 if allocating 4). Of course, these authors may yet contribute reviews to late-breaking work, which has not yet begun, or in other ways, such as being papers chair or AC at a different SIGCHI conference. In practice, a full community analysis would need to consider all ways of volunteering at all the SIGCHI conferences, and even HCI journals, to get a full picture of where community effort is going. Have fun trying to gather all that, and quantify levels of volunteering.
Expertise in the Subcommittees
One bit of data we would still like to investigate one day is the influence of AC experience. For interest’s sake, we examined how many of the ACs had been an AC in the last 5 years (using recent historical data that we had access to – nod to Faraz Faruqi (Assistant to the Papers Chairs), who processed all of the data). This is extremely fallible data (including data entry errors of name spellings from 100+ spreadsheet contributors over 5 years), and some ACs may be really experienced but not in the last 5 years. Recruiting reviewers (and ACs) has seemingly become harder lately, with people considering both the COVID-19 pandemic and expectations from revise and resubmit processes influencing people’s decisions to volunteer in the review process. It was often hard for subcommittee chairs to recruit experienced ACs. It will be hard to measure the impact of the spread of AC experience, but we can see that some subcommittees (rows randomised and left unlabelled on purpose), have more than 50% of ACs taking the role for the first time. As Papers Chairs, we highlighted this kind of data to the subcommittee chairs at recruitment time, however, some were confident in the process and others simply had to go with who would say yes despite the turnover.
|
5 years |
4 years |
3 years |
2 years |
1 year |
First Time |
|
0% |
0% |
21% |
29% |
21% |
29% |
|
0% |
0% |
7% |
43% |
7% |
43% |
|
0% |
3% |
14% |
3% |
21% |
59% |
|
0% |
6% |
12% |
6% |
35% |
41% |
|
0% |
0% |
0% |
46% |
29% |
25% |
|
0% |
0% |
0% |
8% |
15% |
78% |
|
0% |
0% |
0% |
0% |
29% |
71% |
|
0% |
0% |
18% |
29% |
29% |
24% |
|
0% |
3% |
10% |
23% |
47% |
13% |
|
0% |
7% |
7% |
17% |
30% |
40% |
|
0% |
9% |
9% |
22% |
22% |
39% |
|
0% |
20% |
20% |
13% |
33% |
13% |
|
0% |
11% |
11% |
50% |
11% |
17% |
|
0% |
5% |
0% |
18% |
50% |
27% |
|
0% |
0% |
0% |
4% |
30% |
65% |
|
0% |
0% |
4% |
4% |
21% |
71% |
|
4% |
0% |
9% |
26% |
13% |
48% |
|
0% |
0% |
42% |
11% |
26% |
21% |
|
0% |
9% |
13% |
35% |
17% |
26% |
In terms of the expertise that people self-assigned when providing a review (a confidence/expertise score, graded out of 4, submitted with the review), we can see from the following table, that the process maintained a good level of expertise in each of the subcommittees. The average self-assigned expertise in each subcommittee ranges from 3.03 to 3.34, where 3 represents ‘knowledgeable,’ and 4 represents ‘expert.’ The table below also shows the total number of people involved in each subcommittee, and the number of papers they handled.
| Subcommittee | Papers | People Involved | Avg. Expertise |
|---|---|---|---|
| Accessibility & Aging | 193 | 311 | 3.3 |
| Specific Applications Areas | 151 | 287 | 3.03 |
| Computational Interaction | 178 | 317 | 3.08 |
| Critical Computing, Sustainability, and Social Justice | 177 | 348 | 3.11 |
| Design | 239 | 442 | 3.1 |
| Building Devices: Hardware, Materials, and Fabrication | 94 | 151 | 3.34 |
| Games and Play | 131 | 209 | 3.11 |
| Health | 206 | 338 | 3.22 |
| Interaction Beyond the Individual | 151 | 278 | 3.06 |
| Interacting with Devices: Interaction Techniques & Modalities | 217 | 380 | 3.14 |
| Learning, Education, and Families | 187 | 323 | 3.14 |
| Understanding People – Mixed and Alternative Methods | 158 | 276 | 3.13 |
| Understanding People – Qualitative Methods | 152 | 277 | 3.05 |
| Understanding People – Quantitative Methods | 148 | 280 | 3.05 |
| Privacy and Security | 132 | 215 | 3.2 |
| Blending Interaction: Engineering Interactive Systems & Tools | 198 | 344 | 3.15 |
| User Experience and Usability | 244 | 424 | 3.1 |
| Visualization | 151 | 245 | 3.29 |
Interestingly, unlike ACs, reviewers did not exclusively review for specific subcommittees. Of the 607 reviewers that provided 3 or more reviews, the average number of subcommittees they reviewed for was 2.68, with a maximum of 6 different subcommittees and a minimum of 1. As an example, the average number of subcommittees reviewed for by reviewers who produced exactly 3 reviews was 2.22, implying most reviewed each paper for a different subcommittee. The table below shows the overlap of reviewers across the different subcommittees.
|
|
Access |
Apps |
CompInt |
Critical |
Design |
Devices |
Games |
Health |
Ibti |
IntTech |
Learning |
People Mixed |
People Qual |
People Quant |
Privacy |
Systems |
UX |
Viz |
|
Access: |
|
17 |
18 |
19 |
21 |
5 |
11 |
30 |
16 |
10 |
21 |
20 |
20 |
13 |
12 |
17 |
25 |
7 |
|
Apps: |
17 |
|
17 |
29 |
24 |
8 |
4 |
22 |
17 |
13 |
25 |
21 |
19 |
6 |
13 |
22 |
24 |
10 |
|
CompInt: |
18 |
17 |
|
10 |
18 |
8 |
7 |
12 |
21 |
30 |
21 |
26 |
14 |
18 |
3 |
46 |
21 |
22 |
|
Critical: |
19 |
29 |
10 |
|
44 |
1 |
10 |
25 |
29 |
2 |
10 |
28 |
33 |
10 |
9 |
8 |
10 |
3 |
|
Design: |
21 |
24 |
18 |
44 |
|
18 |
11 |
25 |
16 |
25 |
13 |
27 |
20 |
13 |
15 |
25 |
32 |
8 |
|
Devices: |
5 |
8 |
8 |
1 |
18 |
|
0 |
8 |
0 |
23 |
6 |
5 |
2 |
2 |
0 |
19 |
5 |
1 |
|
Games: |
11 |
4 |
7 |
10 |
11 |
0 |
|
10 |
10 |
8 |
11 |
10 |
6 |
11 |
3 |
5 |
22 |
2 |
|
Health: |
30 |
22 |
12 |
25 |
25 |
8 |
10 |
|
13 |
7 |
18 |
26 |
26 |
14 |
7 |
8 |
24 |
7 |
|
Ibti: |
16 |
17 |
21 |
29 |
16 |
0 |
10 |
13 |
|
7 |
21 |
30 |
27 |
16 |
8 |
13 |
15 |
6 |
|
IntTech: |
10 |
13 |
30 |
2 |
25 |
23 |
8 |
7 |
7 |
|
13 |
11 |
5 |
15 |
2 |
43 |
53 |
13 |
|
Learning: |
21 |
25 |
21 |
10 |
13 |
6 |
11 |
18 |
21 |
13 |
|
19 |
10 |
11 |
11 |
23 |
23 |
8 |
|
PeopleMixed: |
20 |
21 |
26 |
28 |
27 |
5 |
10 |
26 |
30 |
11 |
19 |
|
25 |
20 |
14 |
11 |
27 |
10 |
|
PeopleQual: |
20 |
19 |
14 |
33 |
20 |
2 |
6 |
26 |
27 |
5 |
10 |
25 |
|
16 |
9 |
16 |
12 |
5 |
|
PeopleQuant: |
13 |
6 |
18 |
10 |
13 |
2 |
11 |
14 |
16 |
15 |
11 |
20 |
16 |
|
9 |
14 |
27 |
7 |
|
Privacy: |
12 |
13 |
3 |
9 |
15 |
0 |
3 |
7 |
8 |
2 |
11 |
14 |
9 |
9 |
|
5 |
12 |
2 |
|
Systems: |
17 |
22 |
46 |
8 |
25 |
19 |
5 |
8 |
13 |
43 |
23 |
11 |
16 |
14 |
5 |
|
27 |
28 |
|
UX: |
25 |
24 |
21 |
10 |
32 |
5 |
22 |
24 |
15 |
53 |
23 |
27 |
12 |
27 |
12 |
27 |
|
19 |
|
Viz: |
7 |
10 |
22 |
3 |
8 |
1 |
2 |
7 |
6 |
13 |
8 |
10 |
5 |
7 |
2 |
28 |
19 |
|
Conclusions
It’s clear from the analysis that there is a wide range in how long reviews are. Length obviously does not alone equal quality, but reviews judged as ‘good’ by 1ACs that they are typically longer (approaching 1000 words) rather than being less than 500 words. I’m in awe of the role models that wrote 8 reviews with an average above 1000 words – in a way, I hope this post helps raise awareness of good practice (as it appears to be). One challenge seems to be workload, however, as ACs typically wrote shorter reviews – this is something for future papers chairs to consider about the workload of ACs. Of course to reduce this, we need more ACs, which creates a different problem (variability and large crowd management in the PC meeting etc). One thing ACs do (typically) is review much more than their generated review cost (from submitting papers), so increasing the size of the AC group would mean more people are covering their review-debt and reducing individual workload. Most notably, only 1/5 of authors are covering their reviewer-debt, including those working in committees. This is scary. 3/5 of authors, however, are named on just one paper, and perhaps are new authors or out of field authors – we don’t necessarily want everyone to review yet. Looking at it another way, 1/3 of papers generated reviews, but the authors of 2/3 of papers did not produce a commensurate number of reviews. To me, this is more of a concern than individual authors. That said, there are many ways in which people volunteer for the conference, and indeed the wider SIGCHI community, and so perhaps these authors are giving back elsewhere.
Overall, it’s clear to me that many people give massively generous amounts of time to the conference (typically as part of the expectations of their job), and we have too many people for me to name and thank everyone that has done an awesome job this year – so thank you! My biggest hope is that this post helps us as a community to calibrate our understanding of what good reviews should be like, and how much we all volunteer.